
Sustainability · lifecycle figures
97% fewer emissions than beef
measured, not marketed
Millow's footprint is measured per kilogram across the lifecycle and compared like-for-like with beef - figures built to drop into CSR reporting, EU climate goals and public-procurement quotas without a caveat.
Built for the audit: every figure on this page ships with its workings.
97%
less CO₂ than beef, per kg produced
Measured per kilogram produced across the lifecycle, compared like-for-like with beef.
Four figures your CSR report can cite
the lifecycle numbers
Per-kilogram lifecycle comparison against beef. Each headline keeps its underlying quantities next to it - cite them exactly as they read.
- 97%less CO₂0.32 kg vs 21 kg CO₂e per kg
- 660×less water3 L vs 2,000 L per kg
- 71%less energy4 vs 14 kWh per kg
- 77,000×less landa shed vs ~19,000 ha
All figures are measured per kilogram produced, across the full lifecycle, compared like-for-like with beef.
Nordic oats. Made in Sweden. Short chains.
local by design
Millow is grown on rain-fed Nordic oats and made in Sweden - one short, traceable supply chain that reads the same in a procurement file as it does here. It also sits where European funding is already pointing: the approach is EU-backed.

A planet-first whole protein
Putting the low into Millow
Battle of the proteins


97%
less CO₂ emissions than beef

1kg beef produces 21kg CO₂
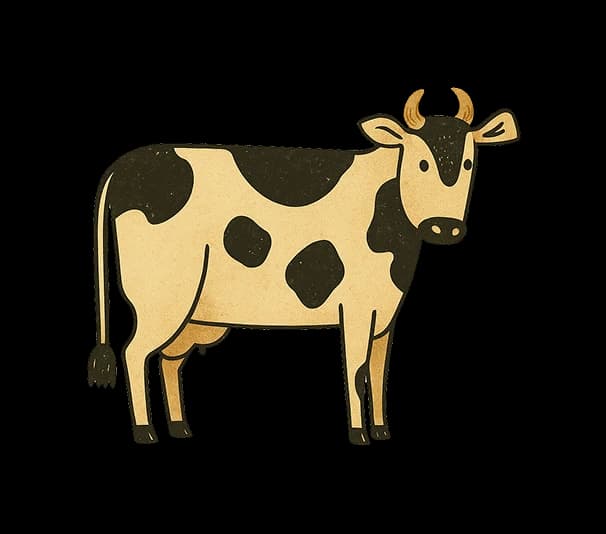

1kg Millow produces 0.32kg CO₂



660×
less water than beef

2,000 L of water for 1kg of beef

Only 3 L of water for 1kg of Millow


71%
less energy than beef

14 kWh required for 1kg beef
Like charging a Renault Zoe

4 kWh required for 1kg Millow
Like charging a scooter


77K
× less land than beef

Beef: 550,000 kg/year needs ~19,000 ha - the area of Stockholm!
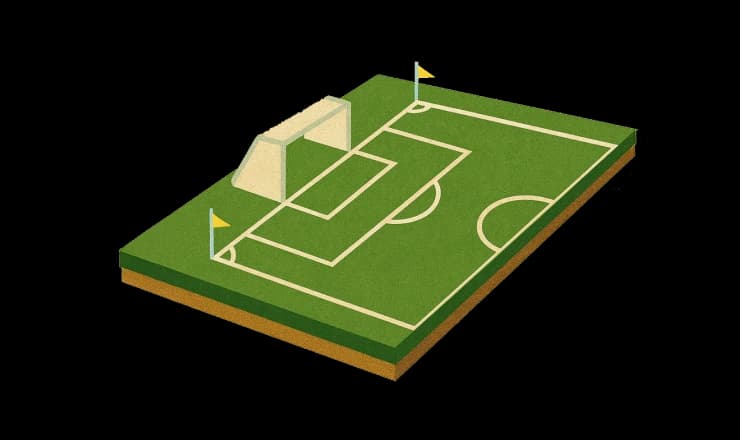
Millow: 550,000 kg/year fits in a shed a third the size of a soccer field…
Comparisons vs conventional beef per kg of protein; lifecycle basis as documented in the Millow data pack.

Impact calculator
See what your organisation can save!
Quick snapshot
- Weekly protein
- 187.5 kg
- Saved weekly
- 3.8 t
- Saved yearly
- 198.9 t
- Trees planted equiv.
- 345
Estimates vs a beef baseline: 20.4 kg CO₂e and 1,997 L of water saved per kg of protein served; tree equivalence 577 kg CO₂e per tree per year. No offsets, no creative accounting.
Documentation, not declarations
audit-ready
Every figure on this page comes with its workings. The lifecycle + CSR data pack collects them in a format your reporting - and your auditor - can use:
- Per-kg lifecycle figures vs beef - CO₂e, water, energy and land, each with its underlying quantities
- Sourcing and production - Nordic oats, made in Sweden, one short traceable chain
- Full nutrition profile - up to 29g protein per 100g, all 9 essential amino acids, high fibre (β-glucans)
97% fewer emissions. 100% clean label. 0% compromise.
Emissions figure measured per kilogram produced across the lifecycle, compared like-for-like with beef.